Compound Interest: The Secret Weapon of Your Savings
Time to read 4 Minutes
Think of interest like a snowball. Whether it’s debt or savings, it can grow over time—especially when it compounds. That means you’re not just earning (or paying) interest on the original amount, but also on the interest that’s already been added. It’s a powerful force that can either work for you or against you. Prefer to watch a video on compound interest- Click here.
How Is Compound Interest Calculated?
Compound interest is what happens when your interest earns interest. Instead of calculating interest only on the original amount (called the principal), it also includes any interest that’s already been added. Over time, this creates a snowball effect—your balance keeps growing, and the growth speeds up the longer you leave it alone.
It usually gets added at regular intervals—like monthly—and the interest rate is usually shown as a yearly percentage.
Let’s say you put $1,000 into a savings account with a 6% annual interest rate, and it compounds monthly. After the first month, you’d earn about $5 (that’s 0.5% of $1,000). The next month, you’d earn 0.5% again, but this time on $1,005, which gives you a little more: $5.025. It might not seem like a big deal at first, but if you leave it alone, it keeps growing faster and faster. After 10 years, that $1,000 turns into $1,819.40—all without you adding a single extra dollar.
How Is Compound Interest Different from Simple Interest?
The most basic type of interest is called simple interest. Unlike compound interest, which adds interest on top of interest, simple interest only looks at the original amount you saved or borrowed (called the principal).
Let’s go back to that $1,000 savings example. If you’re earning 6% simple interest, you’d make $60 a year. After 10 years, that adds up to $600, so your total would be $1,600. Not bad! But since simple interest doesn’t earn interest on itself, it falls short compared to compound interest. In this case, you’d have $219.40 less than if the same rate were compounded monthly.
Compound vs. Simple Interest Over 10 Years
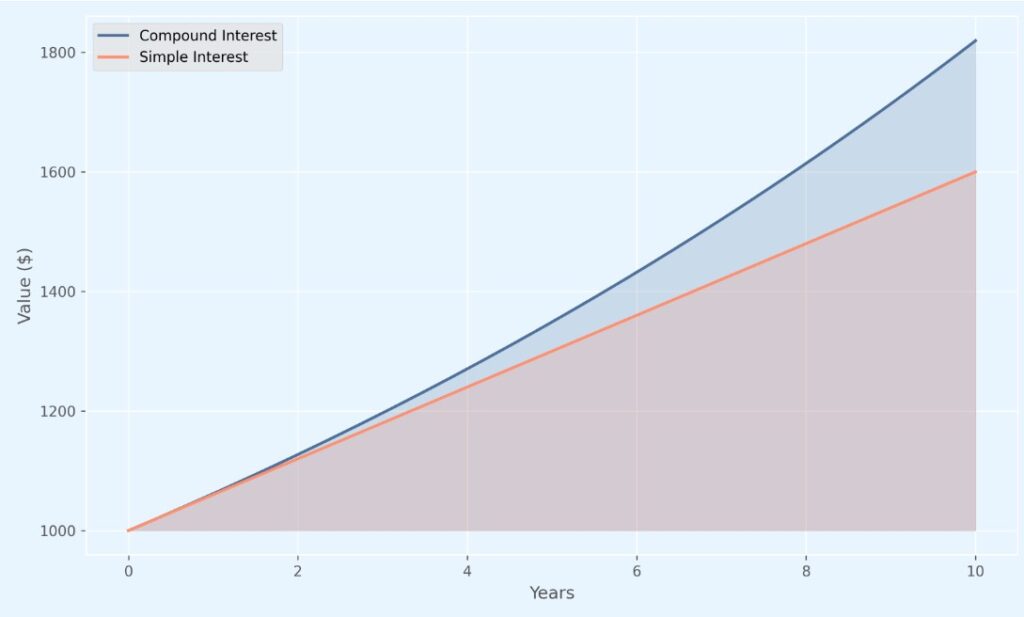
Compound vs. Simple Interest Over 10 Years: This line chart shows how $1,000 grows with compound interest (monthly) vs. simple interest over a decade.
How Does Compound Growth Work in a Retirement Plan?
In a retirement plan like a 401(k), your money is typically invested in mutual funds or ETFs that include stocks and bonds. Unlike a savings account, there’s no fixed interest rate, but the concept of compound growth still applies. As your investments earn returns, those returns can generate even more returns. Over time, this snowball effect can significantly grow your retirement savings.
How Can I Take Full Advantage of Compound Growth in My 401(k) Account?
To make the most of compound growth, here are three simple tips:
Start Saving Early
The earlier you start, the more time your money has to grow. For example, if you want to save $1 million for retirement, starting at age 25 means you’d need to save about $3,036 a year (assuming an 8% return). But if you wait until 30, you’d need to save $4,452 a year—that’s almost 50% more! Time really is money.
Save as Much as You Can
Your 401(k) comes with some nice tax perks that help your money grow faster. In 2026, most people can contribute up to $24,500 a year, and you won’t pay taxes on that money until you take it out in retirement. That means more of your money stays invested and keeps compounding.
And history shows that saving more now can really pay off. Since 1957, the S&P 500 has averaged about 10% a year. If you had invested just $100 back then, it would’ve grown to around $87,000 by 2024. Pretty wild, right?
Put Your Money to Work
Saving is great, but investing is where the real growth happens. A well-balanced mix of stocks and other investments can help your money grow faster than just sitting in a savings account. Stocks can be riskier, but over the long haul, they’ve historically delivered stronger returns. If you’re early in your career, you’ve got time to ride out the ups and downs; some people even put up to 90% of their retirement savings in stocks when they’re young.
The bottom line? Compound growth needs time to work its magic. Even small amounts can turn into something big if you give them enough time to grow.
Let’s Talk
We’re here to help you and your employees navigate the complexities of 401(k) plans and saving for retirement. Contact us to talk about what your business needs.
Learn More
The Power of Compound Growth
Compound growth happens when your savings earn interest and then that interest starts earning interest. Over time, this “growth on growth” can snowball small contributions into significant savings.
| Visual | Audio |
|---|---|
| Green dollar bills with a yellow band around the middle is stacking on top of each other on the screen. The words “Let’s see how it works” appears on screen. | Money has the potential to grow over time when it’s invested. Investing early, and often, enables compound growth, which can help you save more for retirement. Let’s see how it works. |
| Money continues to stack on the screen. The words “Compound growth is how your money makes money” appears on screen. | Simply put, compound growth is how your money makes money. When invested, your money has the opportunity to grow. These earnings then earn their own earnings, and that money grows into even more money. |
| A chart, with the title “30 Year Difference: $5k Invested vs Not” appears on the screen. The X axis contains the values “Year 1” “Year 5” “Year 15” and “Year 30.” The Y axis contains the values “$0” “$10,000” “$20,000” “$30,000” “$40,000” “$50,000” and “$60,000.” Two green lines appear on the screen. A lime green line titled “invested” starts at $0 during year 1 and reaches $50,000 by year 30. Whereas a dark green line titled “not invested” starts at $0 and stays at $0 at year 30. The disclosure “assumes an annual 8% rate of return” appears at the bottom of the chart. | Take a look at this chart. If you were to invest $5,000 now it could turn into $50,000 after 30 years, due to compound growth. On the other hand, not investing that same $5,000, will result in no growth and actually becomes worth less over time due to inflation. |
| A gray rectangular machine appears on screen. On the left side of the screen, money is feeding into the machine, on the right side of the screen, that same money comes out of the machine and beings to multiply. This action repeats. | So, think of your 401(k) like a magic growth machine, every dollar you put in has the power to multiply. It’s full of potential and every dollar counts. The more you put in now—even if it’s a few extra dollars per month—the more time your money has to grow. |
| Three icons appear on screen. The first is a sand hourglass. The words “Don’t try to time the markets” appears underneath. The second figure is a green, yellow, blue and purple bar chart with a magnifying glass hovering over it. The words “Investments fluctuate” appears underneath. The third figure is a red and white bullseye, with an arrow hitting various spots. The words “You could miss out on earnings” appears underneath | Just make sure you don’t cut into that potential by trying to time the markets. Investments are unpredictable by nature and capable of fluctuating. Chances are you’ll miss a lot of potential earnings by buying or selling at the wrong time. |
| A person with long-brown hair appears on the screen. They are sitting at the table with a laptop, to their left a calendar with the month “January” appears. A green check mark appears on one of the dates of the calendar. The next month shows, which is February and this action repeats with the month of March and April | One helpful way to make sure you’re taking full advantage of compound growth is to set aside time each year to review how much you can afford to contribute to your 401(k). Staying on top of your contribution levels could translate into thousands of dollars more for retirement. |
| A chart, with the title “30 Year Difference: $5k Invested vs Not” appears on the screen. The X axis contains the values “Year 1” “Year 5” “Year 15” and “Year 30.” The Y axis contains the values “$0” “$10,000” “$20,000” “$30,000” “$40,000” “$50,000” and “$60,000.” Two green lines appear on the screen. A lime green line titled “invested” starts at $0 during year 1 and reaches $50,000 by year 30. Whereas a dark green line titled “not invested” starts at $0 and stays at $0 at year 30. The disclosure “assumes an annual 8% rate of return” appears at the bottom of the chart. | Harnessing the power of compound growth by staying invested and increasing your savings rate, sets the stage for a comfortable and rewarding retirement. |
| A navy and orange logo Fisher\SMB appears on screen. | Music fades out |